
Stephen M. Mills, CIMA® Partner
Chief Investment Strategist
During the third quarter, the stock market continued the upward trend that began in April, following the Trump administration's announcement of record tariffs on most U.S. trade partners. Since its low on April 9, the S&P 500 Index has increased by 35%, as of its September 30 closing price.1 There were a few minor dips of 1-2% in the key stock market benchmark during that period; however, stocks have maintained a strong rally. Year-to-date, the S&P 500 has delivered a total return of 15%, including dividends through September’s close.1 The tech-led NASDAQ Index has performed even better, with a nearly 18% gain so far in 2025.1
The catalysts for higher stock prices include moderate economic growth, strong corporate earnings, lower interest rates, and positive developments on the tariff front. The U.S. economy continues to slowly advance despite concerns about the negative impact of the Trump tariffs. Although tariff worries have slowed spending on certain imported goods, consumer and business spending remain relatively strong overall. The Commerce Department’s latest economic report on the U.S. economy showed that business investment in software and equipment, including artificial intelligence (AI) applications, rose at a 15% annual rate this year.2 The report also noted that consumer spending increased by 2.5% in the second quarter.2 This spending helped contribute to an estimated 3.8% rise in U.S. gross domestic product (GDP) during the second quarter, the strongest quarter in nearly two years.2 That increase followed a slight contraction of 0.6% in growth in the first quarter, as imports surged from companies trying to avoid the Trump administration’s tariffs. For the first six months of 2025, the U.S. economy grew approximately 1.4%, according to the most recent data from the Department of Commerce's Bureau of Economic Analysis.3
U.S. corporate earnings continue to show strong growth, with 82% of S&P 500 companies beating earnings estimates in the second quarter. Overall, earnings rose by 8% for the quarter and 11.8% year-over-year, according to FactSet. The technology sector led the way, drive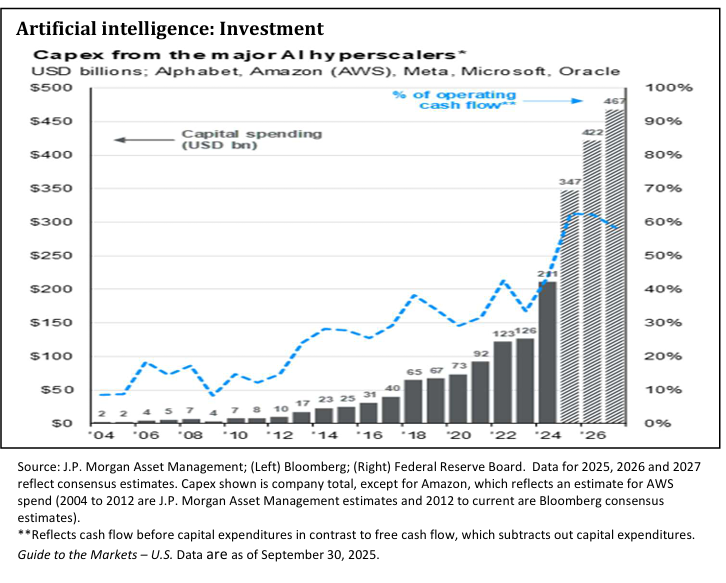 n by substantial investment in AI and other digital services. We expect this trend to continue for several more quarters as businesses adopt AI applications to increase productivity and cut costs. Worldwide AI spending is projected to reach $1.5 trillion in 2025 and exceed $2 trillion in 2026, according to Gartner, a leading global research and advisory firm.4 The chart shows the acceleration of AI capital spending for the five major AI hyperscalers. Hyperscalers are large cloud computing companies that own and operate data centers with horizontally linked servers, enabling them to house and operate AI workloads. We believe that AI will continue to drive innovation and growth across multiple industries for the next several years.
In addition to technology, both the financial and consumer sectors contributed to second-quarter corporate earnings growth, benefiting from increased business and consumer spending. We expect these three sectors to remain the primary drivers of economic growth through 2025 and 2026.
One area of the economy that could significantly impact the U.S. economy in 2026 and 2027 is the industrials sector. The One Big Beautiful Bill Act allows companies to fully expense the costs of manufacturing structures, equipment, and software. Previously, most of these expenses could only be deducted against income over a set number of years. These provisions could boost capital spending, including investments in AI, and significantly enhance economic growth. Several companies have recently announced plans to make substantial investments in U.S. manufacturing facilities, aiming to bring production of goods back to the U.S. from overseas. This is one of the Trump administration's goals behind both the Act and its tariff policy. We believe that these tax breaks, along with President Trump's efforts to deregulate the business sector, could significantly influence U.S. economic growth in the coming years.
In our view, another key factor affecting both the economy and the stock market is the recent decision by the U.S. Federal Reserve Board (the Fed) to begin cutting interest rates. At the Fed’s September Federal Open Market Committee meeting, the 12-member board voted to reduce the federal funds rate by .25% to a range of 4.00 to 4.25%.5 The committee statement noted that the “uncertainty about the economy remains somewhat elevated” and that “downside risks to employment have risen.” Recent U.S. employment data have shown a slowdown in the labor market over the past few months, which may have influenced the Fed’s decision to cut the benchmark rate. The Fed also signaled the possibility of two more rate cuts later this year. The Fed faces a delicate balancing act, with the risk of both inflation and unemployment rising simultaneously. While inflation has fallen significantly over the past two years, it remains above the Fed’s 2% target, currently just below 3%. However, inflation risks have eased enough for the Fed to resume adjusting the federal funds rate toward its “neutral” level at 3.00 to 3.25%.5
We believe the most significant factor influencing the Fed's decision to cut rates in September is the current employment situation. The Bureau of Labor Statistics' latest report, released in August, showed only 22,000 new jobs added, and job openings in the U.S. decreased by 5.5% compared to the same period last year.6 The U.S. unemployment rate has risen over the past few months and is now at 4.3%, the highest since 2021.7 Job growth might stay slow in the coming months as the effects of the Trump tariffs work their way into the economy. Tariffs are essentially taxes on imported goods and are mainly paid by the end user, which includes both businesses and consumers. However, we believe the tariffs will have a relatively moderate impact on economic growth as businesses and consumers adjust to the new trade environment. So far, our observations suggest that the tariff impact has been smaller than many economists expected.
The stock market seems to be ignoring the weakening employment data as the major averages continue to hit new all-time highs almost daily.1 The market has also ignored the U.S. government shutdown that started on October 1 after the Senate failed to pass a temporary stopgap spending bill. The last time the government shut down, in October 2018, stocks declined by about 7% before the shutdown began, but then increased by 10% during the 35 days the government was closed.1 We expect some short-term volatility if the shutdown lasts longer than a few weeks, but we believe that once a resolution is reached, the market will pick up its upward trend.
Corrections during a bull market are a normal part of the process. Typically, in a bull market, the stock market experiences several corrections, ranging from 2% to 10%, and occasionally even larger declines. Since the current bull market began in October 2022, the S&P 500 Index has experienced eight corrections, ranging from 2% to 5%, and one decline of over 10% in April of this year.1 Over the three-year bull market, the S&P 500 Index has increased by over 80%, so it has paid off for investors to stay the course.1
We remain optimistic that stocks will continue to deliver positive returns over the next 12 months. We anticipate the economy will strengthen in 2026, with corporate earnings growth continuing to be robust. With the Federal Reserve easing monetary policy by lowering interest rates, we believe large company growth stocks will continue to lead the market higher. There will almost certainly be market corrections. However, based on our assessment of the current investment environment, we would utilize any corrections to adjust equity allocations as needed, in accordance with the investment objective. We have no idea how long this bull market will last; perhaps longer than most expect. We will continue to monitor economic trends and market conditions, keeping you informed of the latest developments. In the meantime, enjoy the ride!
Your Trinity Capital Management Team
TCM Tyler, TX Location
821 ESE Loop 323, Suite. 200
Tyler, Texas 75701
903-747-3960
Website: www.tcmtx.com
Footnotes*
1Thompson One charts
2 The Wall Street Journal, “Economy Had a Strong Spring, Latest Revisions Show.” September 25, 2025
3Gross Domestic Product | U.S. Bureau of Economic Analysis (BEA)
4Gartner Says Worldwide AI Spending Will Total $1.5 Trillion in 2025
5 Wells Fargo Investment Institute “FOMC Meeting: Key Takeaways,” September 17, 2025
6 CNBC article “Consumer Confidence is Lower Than Expected…” September 30, 2025
7U.S. Bureau of Labor Statistics: U.S. Bureau of Labor Statistics
* To view the footnote links, press and hold down the Ctrl key on your keyboard, hover over the link, and left-click your mouse.
Investment products and services are offered through Wells Fargo Advisors Financial Network, LLC (WFAFN), a Member of SIPC, a registered broker-dealer, and a separate non-bank affiliate of Wells Fargo & Company. Trinity Capital Management, LLC is a separate entity from WFAFN.
Stocks offer long-term growth potential, but may fluctuate more and provide less current income than other investments. An investment in the stock market should be made with an understanding of the risks associated with common stocks, including market fluctuations. Investing in foreign securities presents certain risks not associated with domestic investments, such as currency fluctuation, political and economic instability, and different accounting standards. This may result in greater share price volatility.
The opinions expressed in this report are those of the author(s) and are not necessarily those of Wells Fargo Advisors Financial Network or its affiliates. The material has been prepared or is distributed solely for information purposes and is not a solicitation or an offer to buy any security or instrument or to participate in any trading strategy.
Wells Fargo Advisors Financial Network is not a legal or tax advisor. Consult your tax advisor or accountant for more details regarding your specific circumstance.
Asset allocation cannot eliminate the risk of fluctuating prices and uncertain returns, nor can diversification guarantee profits in a declining market.
The S&P 500 Index comprises 500 stocks selected for their market size, liquidity, and industry group representation. It is a market-value-weighted index, with each stock's weight in the Index proportionate to its market value.
The NASDAQ Composite Index measures the market value of all domestic and foreign common stocks, representing a wide array of more than 5000 companies, listed on the NASDAQ Stock Market.
Index return information is provided for illustrative purposes only. Index returns do not represent investment performance or the results of actual trading. Index returns reflect general market results, assume the reinvestment of dividends and other distributions, and do not reflect deductions for fees, expenses, or taxes applicable to an actual investment. An index is unmanaged and not available for direct investment.
The Consumer Price Index (CPI) is a measure of the cost of goods purchased by the average U.S. household. It is calculated by the U.S. government's Bureau of Labor Statistics.
Past performance is no guarantee of future results, and there is no guarantee that any forward-looking statements made in this communication will be attained.
Compliance Tracking Number: PM-04072027-8474343.1.1