
Stephen M. Mills, CIMA®Partner
Chief Investment Strategist
The performance of the U.S. stock market has been nothing short of remarkable for the past five months as March marked the fifth consecutive month that the U.S. stock market recorded a positive gain, as measured by the S&P 500 Index.1 Since 1950, there have only been 30 instances where the S&P 500 posted a five-month winning streak. In all but two of those instances, the S&P 500 was higher 12 months later with an average gain of 12.5%.2 (Past performance is not a guarantee of future results)
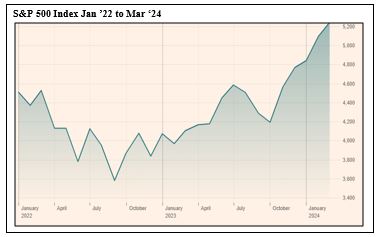
Since bottoming out in October 2022, the S&P 500 has increased by nearly 50% after suffering a decline of 27% from January 2022 to the October ’22 low.1 As we pointed out in our January 2024 letter, the majority of the gains for the market S&P 500 Index in 2023 were attributed to a few mega-cap large-company growth stocks, particularly companies that were involved in artificial intelligence (AI) related technologies. However, since the beginning of the fourth quarter of 2023, we have seen broad-based participation among many sectors of the market. Value stocks and higher dividend-yielding sectors like utilities, energy, financials, consumer staples and REIT’s (real estate investment trusts) which lagged growth stocks for most of 2023 have begun to participate in the market rally. Even small company stocks, which have been badly lagging behind their large cap counterparts, have started to show some signs of life so far in 2024.
This year, the stock market is off to its best start since 2019 with the S&P 500 rising nearly 10% and the closely watched Dow Jones Industrial Average (DJIA) gaining 5.5% as of March 31.1 Any weakness in the market has not lasted more than a few days, with investors buying the dip and sending both the S&P 500 and the DJIA to new highs again and again. The S&P 500 posted 22 all-time highs in the first quarter.2 In our observation of the stock market over the past 30 years, strength tends to beget strength. We wouldn’t be surprised to see stocks continuing to make new highs over the near term, though we could see a period of consolidation of the recent gains at some point in the near future. The S&P 500 has not fallen more than 2% since the rally began in October of last year.3 A 3-5% correction in the major stock market averages could certainly occur sometime in the next few months. However, we would view such a correction as a potential buying opportunity.
We believe the strength behind the move in stocks over the past five months is a combination of the Federal Reserve (Fed) ending its rate-hike cycle in the fourth quarter of last year, the potential of Fed rate cuts in 2024 and 2025, and the anticipation of stronger corporate earnings this year. The Fed paused rate-hikes at the September FOMC meeting last fall after raising the benchmark Fed funds rate from .25% at the beginning of 2022 to 5.5% as of the July 2023 meeting. The Fed kept rates unchanged in its November meeting and also indicated that with the improvement in the inflation data, it may begin lowering the Fed funds rate in 2024. This set off a wave of stock buying that has carried over into 2024. In addition, corporate earnings have been surprisingly strong despite higher interest rates. Fourth quarter 2023 earnings grew by approximately 7% as of March 18, significantly higher than the consensus estimates of a 1.5% increase.4 Many market analysts expect companies in the S&P 500 to report the third straight quarter of earnings growth in the first quarter of 2024. For the year, analysts expect earnings to grow between 7% to 11%.5 A combination of more favorable monetary policy and stronger corporate earnings is a recipe for higher stock prices in our view.
We believe another factor contributing to higher stock prices is the resiliency of the U.S. economy. Many strategists and financial advisors, including ourselves, began 2023 anticipating that the U.S. economy would fall into a mild-to-moderate recession by the end of the year. Thus far, the much-anticipated recession has yet to materialize. In fact, we are becoming more and more convinced that we may be able to avoid a recession altogether. Although the jury is still out, the latest economic data is signaling continued economic growth. One indicator we like to look at is the Conference Board Leading Economic Index. (LEI). The latest release on March 21 showed a .1% increase for February 2024.6 Although that is not much of an increase, it is the first time the LEI had risen on a monthly basis since February 2022. The increase was fueled by strength in the manufacturing and residential construction sectors, two components of the economy that often lead more robust economic activity. Employment growth has continued to be positive with the overall unemployment rate remaining below 4% at 3.9%, according to the February 2024 Employment Situation report released by the Bureau of Labor Statistics (BLS). The U.S. jobs picture remains healthy and supportive of continued economic growth.
Going into 2024, we were cautiously optimistic about the outlook for the U.S. economy and financial markets. Our optimism was based on the resilience of the economy in spite of the sharply higher interests from the Federal Reserve’s 18-month monetary tightening strategy to combat high inflation. The economy grew at an inflation adjusted rate of 2.5% in 2023, according the Bureau of Economic Analysis February 28, 2024 revised GDP report. We believe the growth is due largely to consumer spending which accounts for approximately two-thirds of U.S. economic output. Business spending and manufacturing output has also remained robust over the past year, helping the economy to avoid a recession. We believe that U.S. economic growth will slow in the first half of 2024 but begin to reaccelerate as we move into the second half of the year. At this point, we don’t see a recession developing in the next 12-18 months.
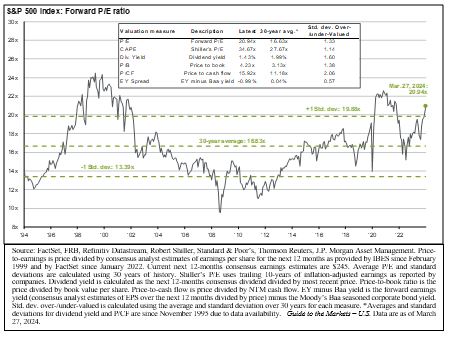
With the stock market is making new highs almost daily, many investors are concerned that valuations are getting too rich and that we may be setting ourselves up for a significant fall in stock prices. As indicated on the accompanying chart, the S&P 500 is trading at a price-to-earnings ratio (P/E) of 20.9 times projected earnings of $245 for 2024.7 This P/E ratio is somewhat higher than the 30-year average of 16.6 but below the P/E ratio of over 24 times earnings at the peak of the dot com era of the 90s. However, if you strip out the top 10 companies in the S&P 500 that trade at over 30 times earnings, the current P/E of the remaining stocks falls to 18 and closer to the long-term average.8
Another concern on investors’ minds is the upcoming Presidential and Congressional elections. Many investors worry that inability of Washington to address major policy issues like the budget deficit, immigration, and geopolitical crises in Ukraine and Israel, as well as the uncertainty surrounding the two Presidential candidates, could have a negative effect on both the economy and the stock market. However, historically the stock market has shrugged off these types of election year concerns. Since 1950, the S&P 500 has risen in a presidential-election year 83% of the time with an average gain of 7.3% gain in those years.3 (Past performance is not a guarantee of future results) It’s difficult to say what impact the election will have on the stock market in the short-term, but we believe that regardless of the outcome and who occupies the White House in 2025 and which party controls Congress, we feel the positive fundamentals of the economy and the strength of corporate America will provide a favorable environment for stocks. More than likely, we end up with no party controlling the White House and Congress resulting in continued grid-lock in Washington. Frankly, in our observation, grid-lock is good. It means that it is unlikely that there will be any major legislation coming out of Washington that could harm business or the economy like tax hikes, or massive spending bills or anti-business legislation.
While the situation with this year’s election may not have much of a impact on the financial markets this year, we believe the direction of the Fed’s monetary policy will certainly play a key role in both the economy and stock market for 2024 and 2025. Coming into the year, investors were expecting the Fed to cut its benchmark short-term rate six times in 2024. That turned out to be overly optimistic, as Fed officials indicated in their March FOMC meeting that they are forecasting only three rate cuts this year. They also indicated that any rate cuts will be dependent on inflation continuing to move toward the Fed’s 2% target annual inflation rate. Inflation, as measured by the Consumer Price Index (CPI), has fallen from an annualized rate of 9% in July 2022 to about 3% at the end of 2023. However, the January and February CPI report indicated a slight uptick in the annual inflation rate which certainly caught the attention of the Fed. The Fed will continue to closely monitor the direction of inflation as well as the employment data in determining when to begin cutting rates. Any further downshifting in the Fed’s rate cut forecast could lead to volatility in the market. We feel this is perhaps the area where the stock market is most vulnerable in the near-term.
While the stock market has been very good for many equity investors lately, the fixed-income markets have been fairly steady this year. Interest rates for money funds and shorter-term securities, and yields on intermediate-to-long-term bonds remain where they started the year in the 4-5% range.1 We continue to see good value for investors in the fixed-income markets. The current level of interest rates for high quality fixed-income instruments provide historically attractive risk-adjusted returns for conservative investors in our view. For investors seeking to generate income as well as for portfolio diversification purposes, we continue to favor U.S. Treasuries, high-grade corporate bonds, mortgage-backed securities, prime money market funds, and tax-free municipal bonds. We view tax-free municipal bonds, with current yields ranging from 3% to 4% for intermediate and longer-term maturities, as very attractive for investors in higher tax brackets. Those tax-free yields calculate to a taxable equivalent yield for investors in a 40% tax bracket of 5% to 6.6%. Investors who are holding significant cash in money funds may want to consider locking in the current yields on intermediate fixed-income instruments in the event the Fed begins lowering the Fed funds rate in 2024.
In summary, we remain very positive on both stocks and bonds for the next 12-18 months. We will likely see greater volatility in the financial markets as we get closer to the election and the uncertainty regarding who will be in control of government weighs on investor sentiment. It is important that investors not overreact to this volatility but continue to focus on long-term goals and objectives and maintain asset allocations. We could use any corrections in stocks and/or bonds as an opportunity to put cash to work where appropriate.
As always, we are very grateful for the confidence and trust you place in us!
Your Trinity Capital Management Team
Tyler TX Location
821 ESE Loop 323, Suite 100
Tyler, Texas 75701
903-747-3960
Webite:www.tcmtx.com
1 Thompson charts
2 Yahoo Finance, “The S&P 500 is up 5 months straight…” March 27, 2024
3 The Wall Street Journal. “The S&P 500 Is Poised for Best Start to Year Since 2019.” March 28, 2024
4 Wells Fargo Investment Institute, Investment Strategy report, March 25, 2024
5 Barron’s, The Stock Market Rally Keeps Going. March, 27, 2024
6 https://www.conference-board.org/topics/us-leading-indicators
7 Factset, Earnings Insight, March 28, 2024.
8 Professor Jeremy Siegel interview on CNBC.
To view the above links, press and hold the Ctrl key on your keyboard, hover over the link and left click your mouse.
Investment products and services are offered through Wells Fargo Advisors Financial Network, LLC (WFAFN), Member SIPC, a registered broker-dealer and separate non-bank affiliate of Wells Fargo and Company. Trinity Capital Management, LLC is separate entity from WFAFN.
Stocks offer long-term growth potential, but may fluctuate more and provide less current income than other investments. An investment in the stock market should be made with an understanding of the risks associated with common stocks, including market fluctuations. Investing in foreign securities presents certain risks not associated with domestic investments, such as currency fluctuation, political and economic instability, and different accounting standards. This may result in greater share price volatility.
The opinions expressed in this report are those of the author(s) and are not necessarily those of Wells Fargo Advisors Financial Network or its affiliates. The material has been prepared or is distributed solely for information purposes and is not a solicitation or an offer to buy any security or instrument or to participate in any trading strategy.
Wells Fargo Advisors Financial Network is not a legal or tax advisor. Consult your tax advisor or accountant for more details regarding your specific circumstance.
Investing in fixed income securities involves certain risks such as market risk if sold prior to maturity and credit risk especially if investing in high yield bonds, which have lower ratings and are subject to greater volatility. All fixed income securities may be worth less than the original cost upon redemption or maturity. Yields and market value will fluctuate so that your investment, if sold prior to maturity, may be worth more or less than its original cost. Bond prices fluctuate inversely to changes in interest rates. Therefore, a general rise in interest rates can result in the decline of the value of your investment. Income from municipal securities is generally free from federal taxes and state taxes for residents of the issuing state. While the interest income is tax-free, capital gains, if any, will be subject to taxes. Income for some investors may be subject to the federal Alternative Minimum Tax (AMT).
The commodities markets are considered speculative, carry substantial risks, and have experienced periods of extreme volatility. Investments in commodities may be affected by changes in overall market movements, commodity index volatility, changes in interest rates or factors affecting a particular industry or commodity.
Asset allocation cannot eliminate the risk of fluctuating prices and uncertain returns nor can diversification guarantee profits in a declining market.
The Consumer Price Index (CPI) is a measure of the cost of goods purchased by average U.S. household. It is calculated by the U.S. government's Bureau of Labor Statistics.
P/E Ratio is a valuation of a company or an index’s current value compared to its earnings per share. It is calculated by dividing the market value per share by earnings per share.
S&P 500 Index: The S&P 500 Index consists of 500 stocks chosen for market size, liquidity, and industry group representation. It is a market value weighted index with each stock's weight in the Index proportionate to its market value.
Index return information is provided for illustrative purposes only. Index returns do not represent investment performance or the results of actual trading. Index returns reflect general market results, assume the reinvestment of dividends and other distributions and do not reflect deduction for fees, expenses or taxes applicable to an actual investment. An index is unmanaged and not available for direct investment.
Past performance is no guarantee of future results and there is no guarantee that any forward-looking statements made in this communication will be attained.
P/M Tracking Number: 10022025-6521254.1.1
TCM Investment Outlook Strategy - April 2024.pdf